Understanding different map types
Below are some of the major map-type groups.
Thematic
There are many types of thematic maps. Their purpose is to emphasise the theme or subject area of a particular set of spatial data. Below a few examples of thematic maps.
Choropleth
Choropleth maps are colored using a monochromatic theme to visualize the measurement of the statistical variable being displayed. A common theme is using Census data to create a choropleth map, such as normalizing unemployment by population to calculate an unemployment rate. Or simply counting the number of electoral votes per president during an election and visualizing with blue and red states. Below is a univariate choropleth map of the unemployment rate in June 2010. Source: New York Times.

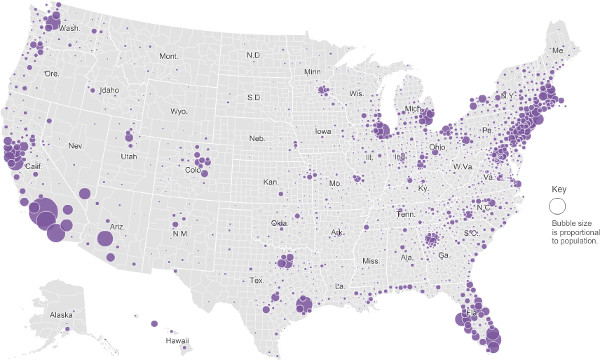
Graduated Symbols
Below is a graduated symbols map using circles to show population of areas. The larger the circle, the higher the population count. The map visualizes settlements of English-born immigrants in the United States during 2000. Source: New York Times.
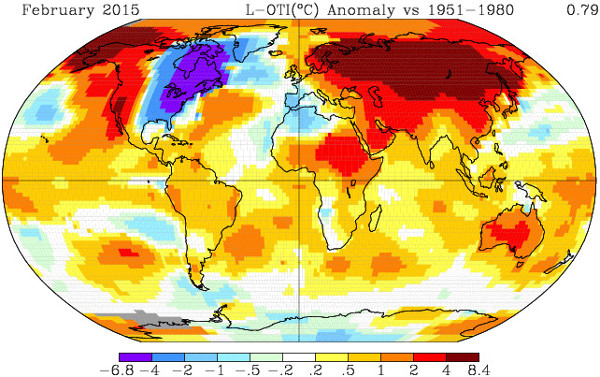
Weather
Weather as a theme. GISS Surface Temperature Analysis. Source: NASA
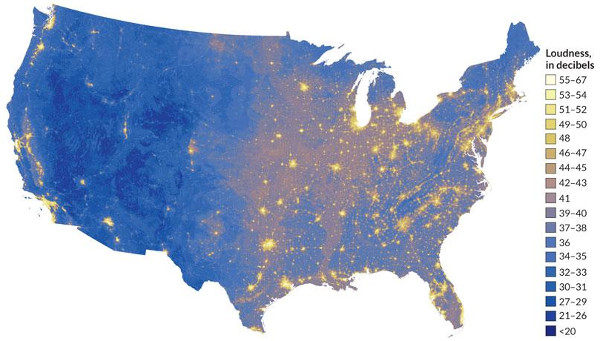
Sound
Mapping sound. Source: NPS Sounds & Night Skies Division.
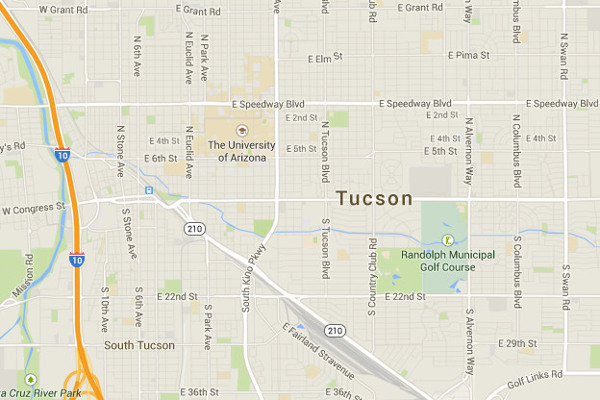
Reference
Reference maps visualize multiple types of data without focusing on one particular dataset and are meant for referencing locations. Think of how Google would have to use so many layers to create Google Maps; roads, rivers, cities, national park boundaries, satallite imagery, etc. Below is an example of reference maps. Source: Google Maps.
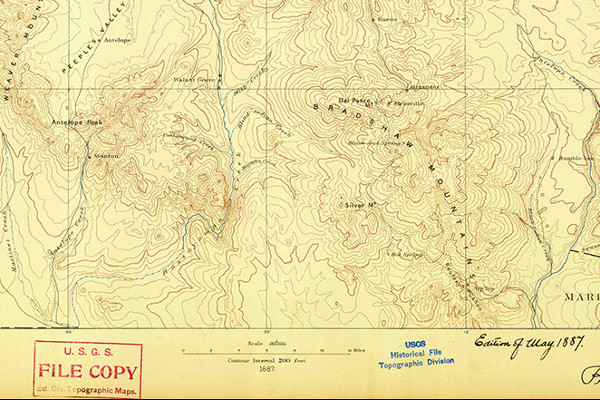
Topographic
Topographic maps emphasize physical features in an area. Contour lines help visualize elevations- lines connecting points of equal elevation above the mean sea level. The United States Geological Survey is best known for their US topographic quadrangle maps. You can download them here for free. Below is an example of a historic 1x1 degree (60 arcminutes) quadrangle drawn by hand, you’ll have to click to enlarge it. Source USGS.
Navigation
Navigational maps are used for navigating. The roads in Google Maps help you get from once place to the next. Sailors need to know shipping routes and ports. Or the hiking route you’ve just found from researching online. Below are some examples of navigational maps.
References